3. Getting started
This guide will walk you through the steps necessary to understand, install, and use iCOMIC for carrying out analysis on your data.
3.1. iCOMIC overview
iCOMIC is an open-source, stand-alone toolkit for genomic data analysis, characterized by a python based Graphical User Interface. The tool enables researchers with minimal programming expertise to draw consequential insights from DNA-Seq and RNA-Seq data along with machine learning tools cTaG and NBDriver.
3.2. Install iCOMIC
Installation is easy as we provide conda environment (icomic_env.yml for linux and icomic_env_mac.yml for MacOS ) files comprising all the software dependencies. Once you clone the iCOMIC github repository, you can install all the associated dependencies using the command below by creating a new conda environment.
$ conda env create -f icomic_env.yml #for Linux users
$ conda env create -f icomic_env_mac.yml #for MacOS users
Refer to the 3.4 or section 2.3 of Tutorials for the detailed step by step instructions for the installation.
3.3. The components
3.3.1. Snakemake
iCOMIC is embedded in Snakemake, a Python based workflow manager. Different tools integrated in iCOMIC are connected using Snakemake. Individual ‘Rules’ corresponding to each tool form the building units, which describes how the desired output is obtained from the input. Rules consist of information about the input and output files and wrapper script or shell command. Tools without wrapper scripts are configured separately and shell command is used for their execution. According to the choice of tools made by the user, corresponding rules are combined in a ‘Snakefile’ to generate target output. All the input information and parameters corresponding to each tool is specified in a configuration file, ‘config file’. ‘Rules’ are predefined and are made available together with the iCOMIC package. All the other files are generated on the flow according to the user inputs and are updated accordingly.
3.3.2. PyQt5 GUI
iCOMIC is characterized by a Graphical user Interface which enhances the accessibility of the toolkit. The GUI framework is built using PyQt5, python binding of the cross-platform GUI toolkit Qt. The GUI framework allows users with minimal programming expertise to perform analysis.
3.4. Launching the wrapper
iCOMIC can be launched using a simple command in the terminal.
$ cd iCOMIC-main
$ conda env create -f icomic_env.yml #for Linux
$ conda env create -f icomic_env_mac.yml #for MacOS
$ conda activate icomic_env
$ pip install -e icomic #for the first time only
$ cd icomic #path/to/icomic directory
$ icomic
$ conda deactivate #after completing the analysis
3.5. Input file format
iCOMIC accepts input information in two different modes. The user can either feed the path to a folder containing raw fastq files or provide a table consolidating particulars of raw data.
If you are uploading a folder of fastq files, all the files should be named in the specified format:
(sample_name)_(condition(tumor/normal))_Rep(replicate_number)_R(1 / 2).fastqExample: hcc1395_normal_Rep1_R1.fastq
If you choose upload a table, the sample information should be given in a tab delimited file with a header row.
The Column names should be:
Sample: The Sample nameUnit: The number of replicatesCondition: Nature of the sample, Normal or Tumorfq1: The path of Read 1fq2: Path of Read 2, if you are working with single-end reads only, the ‘fq2’ column can be left blank.
3.6. Quick Guide
iCOMIC toolkit enables the ready analysis of RNA-Seq and Whole Genome/Exome Sequencing data. iCOMIC has an inbuilt library of tools with predefined valid combinations.
The user will have the freedom to choose any possible combination of tools. Figure 1 and 2 depicts the basic steps and outputs involved in DNA-Seq and RNA-Seq pipelines respectively.
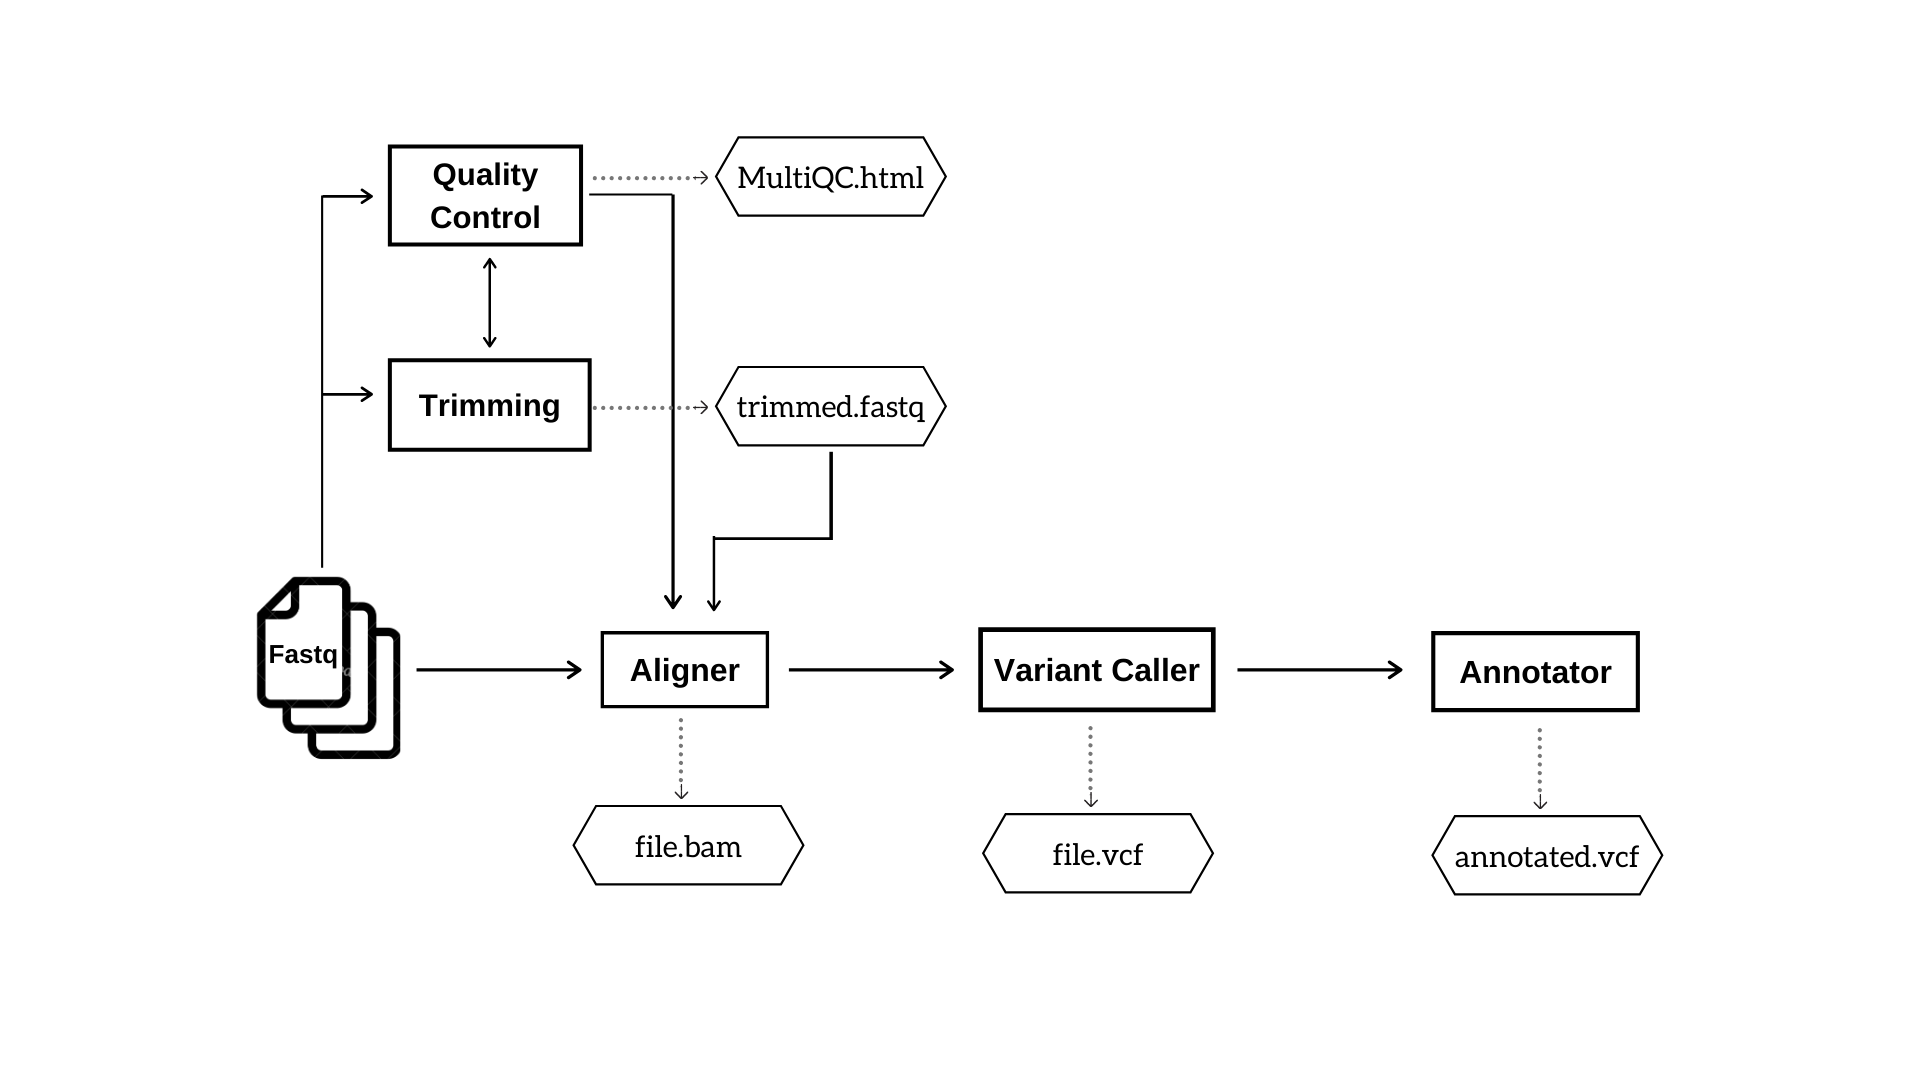 Figure 1: DNA Seq pipeline. This workflow indicates the analysis steps and major output files in DNA Seq pipeline.
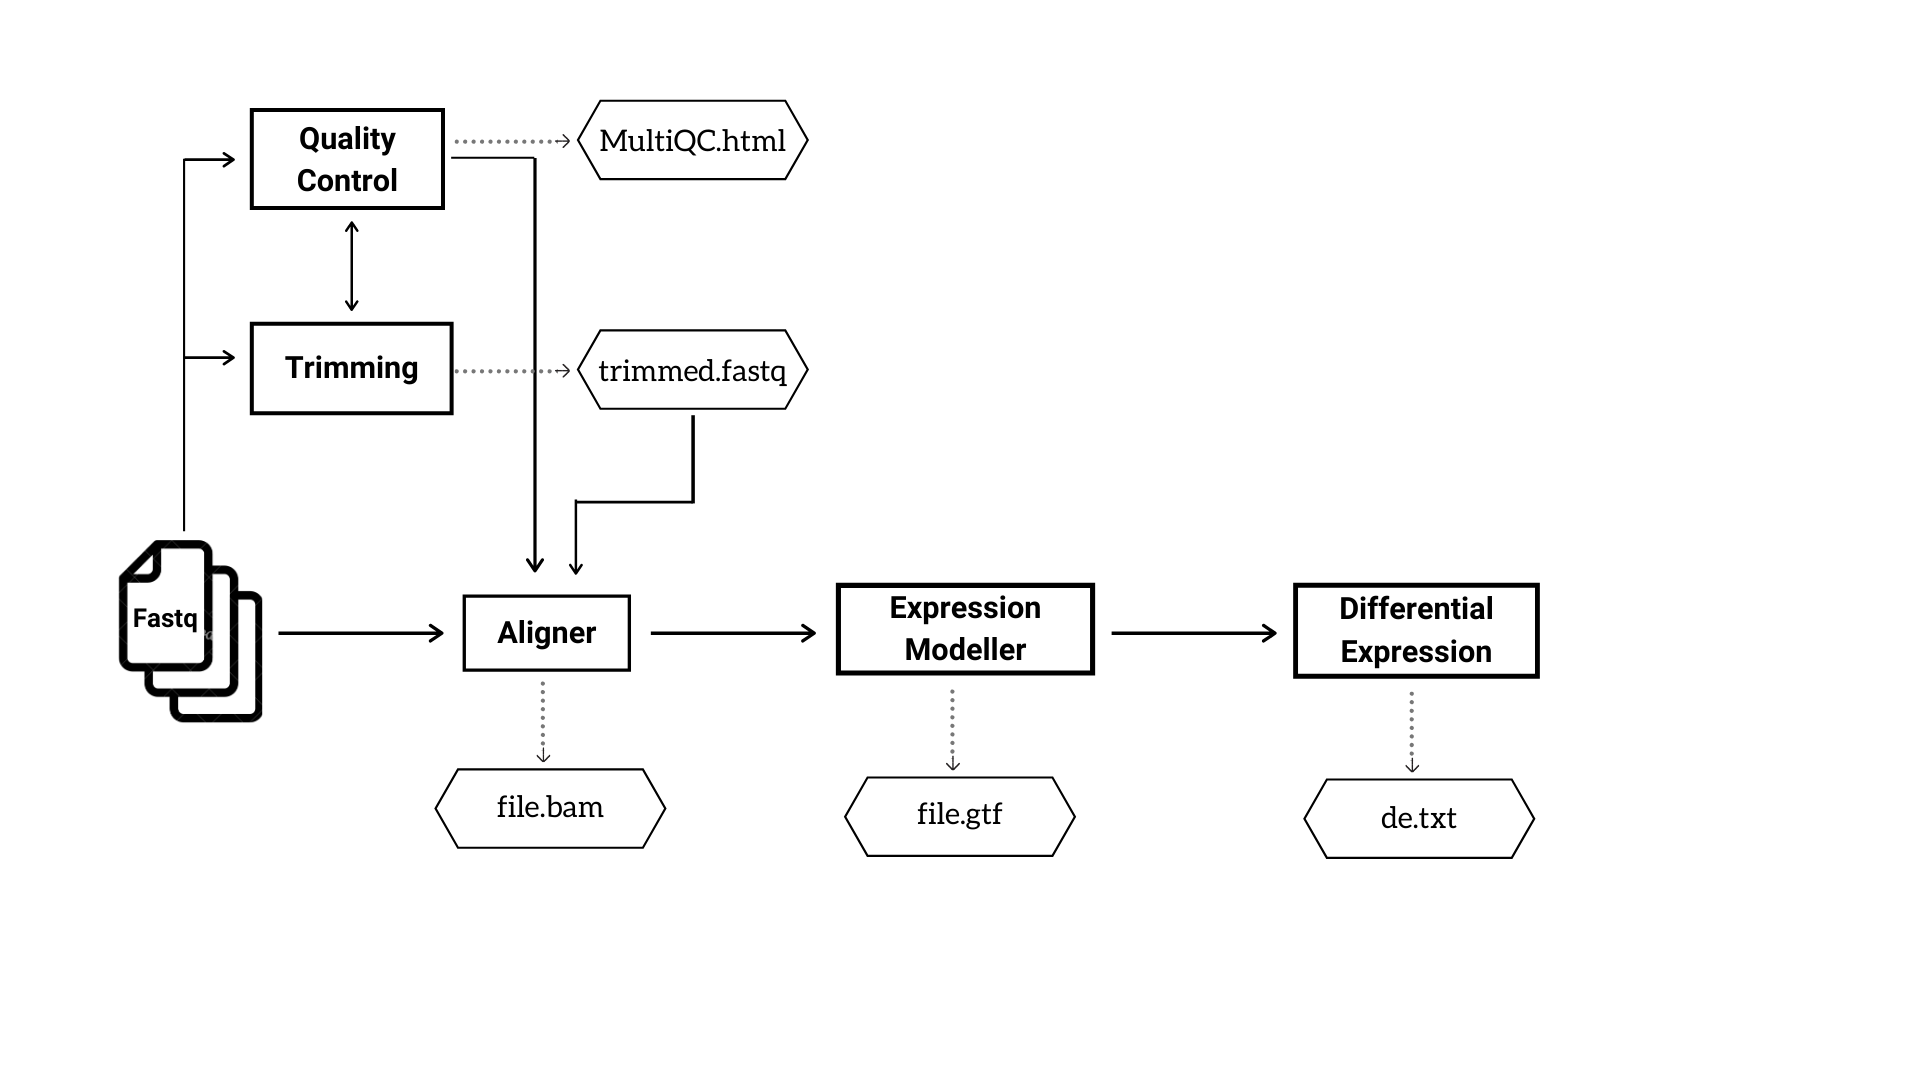 Figure 2: The analysis steps and major output files in RNA Seq pipeline.
Refer to the section 9 of Tutorials for the typical set of actions to run iCOMIC pipelines.
3.7. Output information
All outputs are stored in separate folders inside the main folder iCOMIC, for each pipeline along with log information.
DNA-Seq
DNA-Seq analysis generates five output folders as follows.
- MultiQC
Contains subfolders MultiQC, FastQC and Cutadapt. MultiQC contains consolidated html reports on the overall run statistics and a separate html file on merged FastQC reports of all the input samples. The folder FastQC contains quality reports of individual samples. It may also enclose FastQC report of trimmed reads if the user opts for trimming the input reads. The folder Cutadapt contains trimmed fastq files.
- Aligner
Contain bam outputs generated by the aligner.
- Variant Caller
This folder includes vcf files of identified variants.
- Annotator
Contains annotated vcf files.
- Index
This is an optional folder which contains the index files if the user chooses to generate index corresponding to the choice of aligner.
RNA-Seq
RNA-Seq analysis generates five output folders inside the main folder iCOMIC, as follows.
- MultiQC
Contains subfolders MultiQC, FastQC and Cutadapt. MultiQC contains consolidated html reports on the overall run statistics and a separate html file on merged FastQC reports of all the input samples. The folder FastQC contains quality reports of individual samples. It may also enclose FastQC report of trimmed reads if the user opts for trimming the input reads. The folder Cutadapt contains trimmed fastq files.
- Aligner
Contain bam outputs generated by the aligner.
- Expression Modeller
Contains count matrix representing the reads mapped to individual genes.
- Differential expression
Contain a text file with a consolidated list of differentially expressed genes.
- Index
This is an optional folder which contains the index files if the user chooses to generate index corresponding to the choice of aligner.
cTaG
cTaG (classify TSG and OG) is a tool used to identify tumour suppressor genes (TSGs) and oncogenes (OGs) using somatic mutation data.The cTaG model returns the list of all genes labelled as TSG or OG or unlabelled along with predictions made my each model and whether the gene is among top predictions.
NBDriver
NBDriver (NEIGHBORHOOD Driver) is a tool used to differentiate between driver and passenger mutations. It returns a list of all mutations labelled as Driver or Passenger.