iCOMIC_doc
Documents
iCOMIC User Guide v0.0.0
iCOMIC (Integrating Context Of Mutation In Cancer) an open-source, standalone tool for genomic data analysis characterized by a Python-based Graphical User Interface and automated Bioinformatics pipelines for DNA-Seq and RNA-Seq data analysis along with Machine Learning tools cTaG and NBDriver for cancer related data analysis. It serves as a point and click application facilitating genomic data analysis accessible to researchers with minimal programming expertise.
1. About
iCOMIC is a user-friendly pipeline to analyze genomic data that takes in raw sequencing data in FASTQ format as an input, and finally outputs insightful statistics on it’s nature. iCOMIC toolkit is capable of analyzing both Whole Genome and transcriptome data and is embedded in ‘Snakemake’, a workflow management system. iCOMIC is characterized by a user-friendly GUI built using PyQt5 which increases its ease of access. The toolkit features many independent core workflows in both whole genomic and transcriptomic data analysis pipelines.
1.1 Major features
- Serves as a stand-alone end to end analysis toolkit for DNA-Seq and RNA-Seq data
- Contains machine learning tools cTaG and NBDriver developed in-house
- Characterized by an interactive and user friendly GUI, specifically built to accommodate users with minimal programming expertise
- Provides expert bioinformaticians a platform to perform analysis incorporating advanced parameters, saving time on building a pipeline
- Consists of multiple flexible workflows
- Users freedom to select tools from the predesigned combinations best suited for their requirements
- Easy installation of tools and dependencies
2. Installation
Setting up iCOMIC is comparatively effortless across Linux or Mac platforms. iCOMIC works with Python 3.6 or above.
2.1. Prerequisites
- Linux/Windows/Mac(MacOS v10.15.5 or above) platform
- Python 3.6 and above
- Miniconda
- iCOMIC package downloaded from GitHub or Docker installed (only for Linux)
2.2. Github download and installation
The entire source code for the tool is available at this link. The user can either download as a zip file directly or git clone and follow the steps in section 2.2.1
2.2.1 Conda Installation
Create an environment and install the dependencies associated with iCOMIC by using the following command
Step 1:
$ cd iCOMIC-main
After cloning iCOMIC directory, move inside the directory where the environment file exists.
Step 2 - For Linux users:
$ conda env create -f icomic_env.yml #for the first time only
This helps in creating an environment, which contains all the necessary requirements.
Step 2 - For MacOS users:
$ conda env create -f icomic_env_mac.yml #for the first time only
This helps in creating an environment, which contains all the necessary requirements.
Step 3:
$ conda activate icomic_env
Activating the created environment.
Step 4:
$ pip install -e icomic #for the first time only
To install icomic
Step 5:
$ cd icomic #path/to/icomic directory
Move inside icomic directory to run the tool.
Step 6:
$ icomic
Opens the GUI by typing this command everytime.
step 7:
$ conda deactivate #after completing the analysis
Deactivates the environment
2.3. Installation with Docker image
iCOMIC can be run in Linux system using docker image. Please install the Docker on your system and test the installation using
$ docker -v
Running the following command, by default will launch iCOMIC and is ready to use. Make sure to add the path to your local directory containing samples. Docker support for Mac or Windows platforms will be extended in subsequent releases of iCOMIC.
$ docker run -e DISPLAY=$DISPLAY -v /tmp/.X11-unix:/tmp/.X11-unix -v </path/to/local/directory>:</path/to/local/directory> ramanlab/icomic:latest
Please visit Troubleshooting section of this document if you encounter errors while docker installation of iCOMIC.
2.4. Windows Installation
For iCOMIC, some dependencies are platform specific, and hence the environment file created in Linux failed when we tried to recreate it in Windows. The primary reason for this is that most NGS analysis tools are unix-based and consequently the conda environment for iCOMIC had to be created on an unix-based OS. Also, NGS analysis is computationally intensive and requires access to high performance computing (HPC) frameworks and since Linux is the most widely used OS for HPC systems, we feel that users won’t face any issue while running our pipelines. However, we have suggested a workaround in the documentation for users with a windows OS. This involves installing and opening iCOMIC by creating a Windows Subsystem for Linux (WSL) session inside MobaXterm, a widely-used toolbox for remote computing. Please find the steps mentioned below:
- Install WSL. Documentation
- Install Miniconda inside WSL. Reference
- Install MobaXterm Home edition. It is a free software that offers enhanced terminal for Windows with an X11 server. Documentation
- Open a WSL terminal inside MobaXterm (Open MobaXterm –> Click on Sessions –> New Sessions –> WSL –> Select Linux distribution –> OK)
- Follow the instructions in Section 2.2 of the iCOMIC documentation.
Note: While installing iCOMIC in Windows 11 Steps 3 and 4 can be skipped (if wanted) and this documentation can be followed instead.
3. Getting started
This guide will walk you through the steps necessary to understand, install, and use iCOMIC for carrying out analysis on your data.
3.1. iCOMIC overview
iCOMIC is an open-source, stand-alone toolkit for genomic data analysis, characterized by a python based Graphical User Interface. The tool enables researchers with minimal programming expertise to draw consequential insights from DNA-Seq and RNA-Seq data along with machine learning tools cTaG and NBDriver.
3.2. Install iCOMIC
Installation is easy as we provide conda environment (icomic_env.yml for linux and icomic_env_mac.yml for MacOS ) files comprising all the software dependencies. Once you clone the iCOMIC github repository, you can install all the associated dependencies using the command below by creating a new conda environment.
$ conda env create -f icomic_env.yml #for Linux users
$ conda env create -f icomic_env_mac.yml #for MacOS users
Refer to the 3.4 or section 2.3 of Tutorials for the detailed step by step instructions for the installation.
3.3. The components
3.3.1. Snakemake
iCOMIC is embedded in Snakemake, a Python based workflow manager. Different tools integrated in iCOMIC are connected using Snakemake. Individual ‘Rules’ corresponding to each tool form the building units, which describes how the desired output is obtained from the input. Rules consist of information about the input and output files and wrapper script or shell command. Tools without wrapper scripts are configured separately and shell command is used for their execution. According to the choice of tools made by the user, corresponding rules are combined in a ‘Snakefile’ to generate target output. All the input information and parameters corresponding to each tool is specified in a configuration file, ‘config file’. ‘Rules’ are predefined and are made available together with the iCOMIC package. All the other files are generated on the flow according to the user inputs and are updated accordingly.
3.3.2. PyQt5 GUI
iCOMIC is characterized by a Graphical user Interface which enhances the accessibility of the toolkit. The GUI framework is built using PyQt5, python binding of the cross-platform GUI toolkit Qt. The GUI framework allows users with minimal programming expertise to perform analysis.
3.4. Launching the wrapper
iCOMIC can be launched using a simple command in the terminal.
$ cd iCOMIC-main
$ conda env create -f icomic_env.yml #for Linux
$ conda env create -f icomic_env_mac.yml #for MacOS
$ conda activate icomic_env
$ pip install -e icomic #for the first time only
$ cd icomic #path/to/icomic directory
$ icomic
$ conda deactivate #after completing the analysis
3.5. Input file format
iCOMIC accepts input information in two different modes. The user can either feed the path to a folder containing raw fastq files or provide a table consolidating particulars of raw data.
If you are uploading a folder of fastq files, all the files should be named in the specified format:
(sample_name)_(condition(tumor/normal))_Rep(replicate_number)_R(1 / 2).fastqExample: hcc1395_normal_Rep1_R1.fastq
If you choose upload a table, the sample information should be given in a tab delimited file with a header row.
The Column names should be:
Sample: The Sample nameUnit: The number of replicatesCondition: Nature of the sample, Normal or Tumorfq1: The path of Read 1fq2: Path of Read 2, if you are working with single-end reads only, the ‘fq2’ column can be left blank.
3.6. Quick Guide
iCOMIC toolkit enables the ready analysis of RNA-Seq and Whole Genome/Exome Sequencing data. iCOMIC has an inbuilt library of tools with predefined valid combinations.
The user will have the freedom to choose any possible combination of tools. Figure 1 and 2 depicts the basic steps and outputs involved in DNA-Seq and RNA-Seq pipelines respectively.
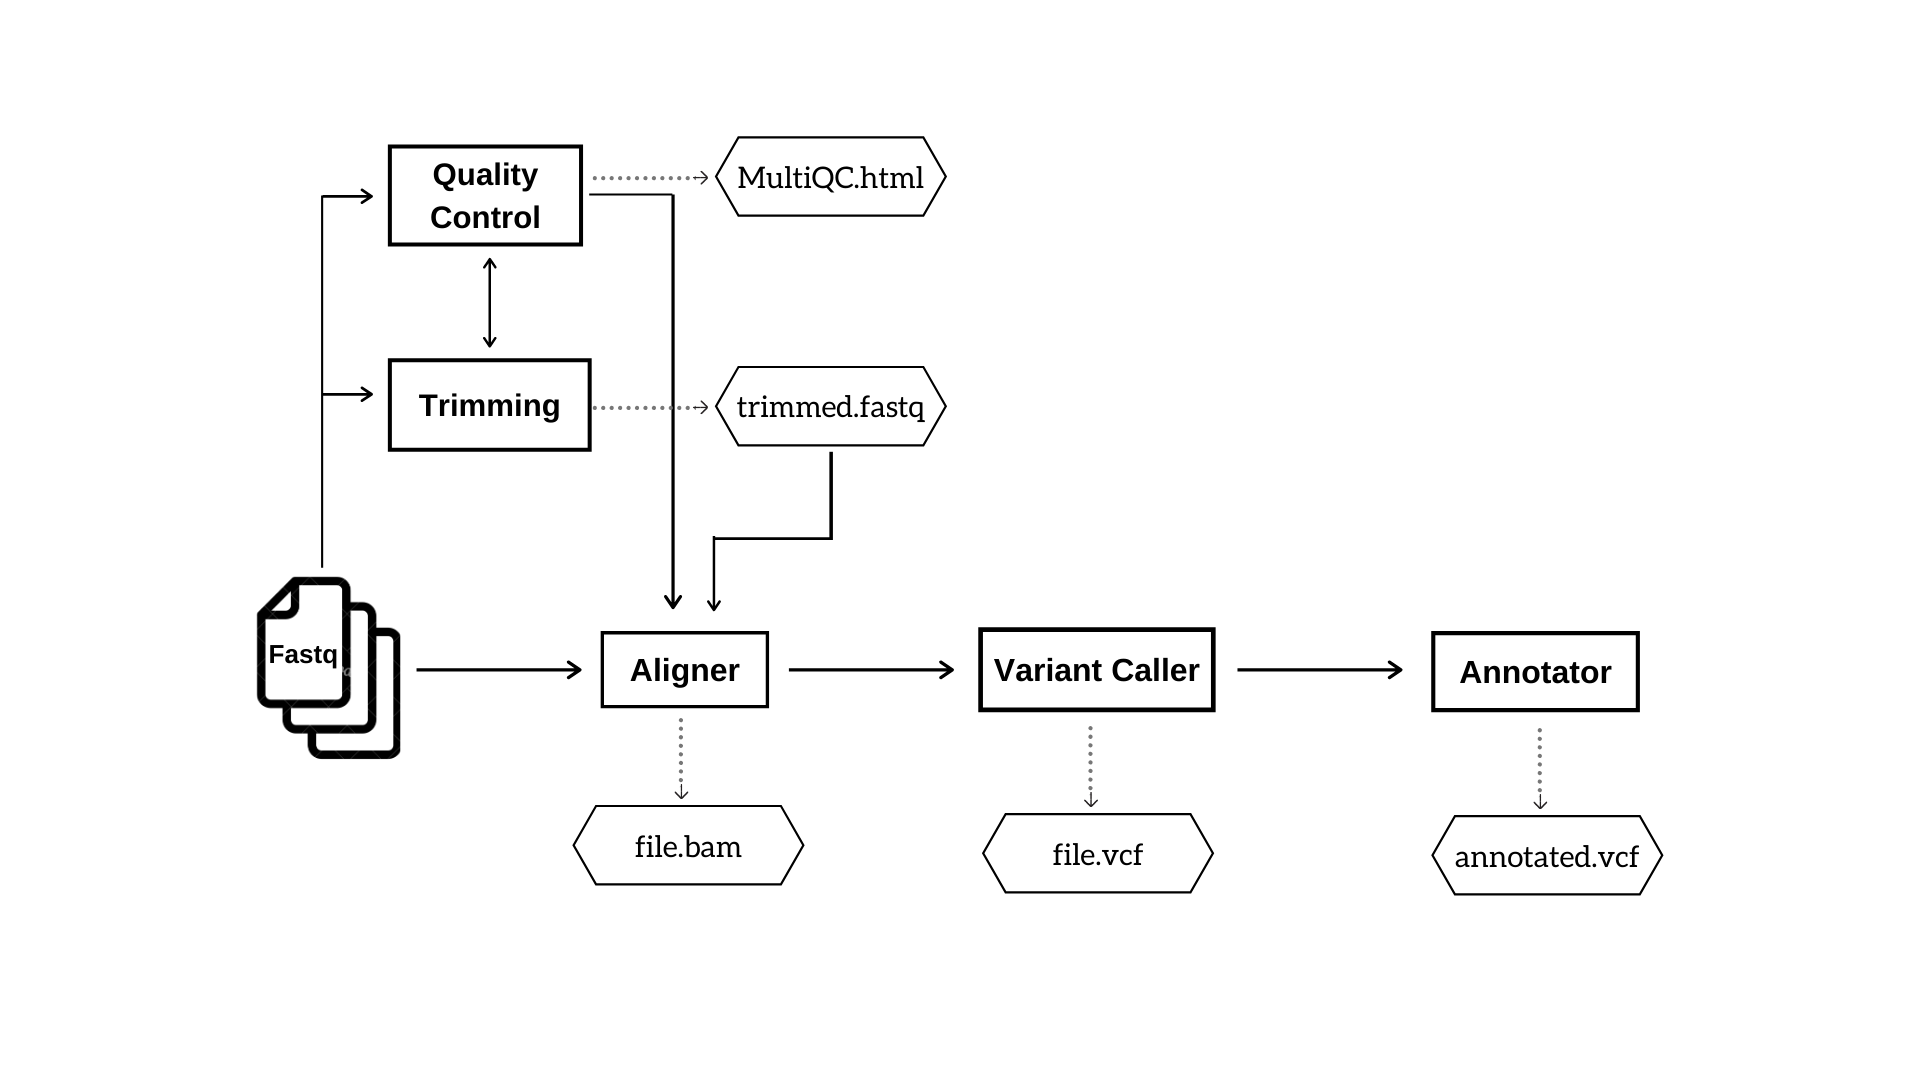 Figure 1: DNA Seq pipeline. This workflow indicates the analysis steps and major output files in DNA Seq pipeline.
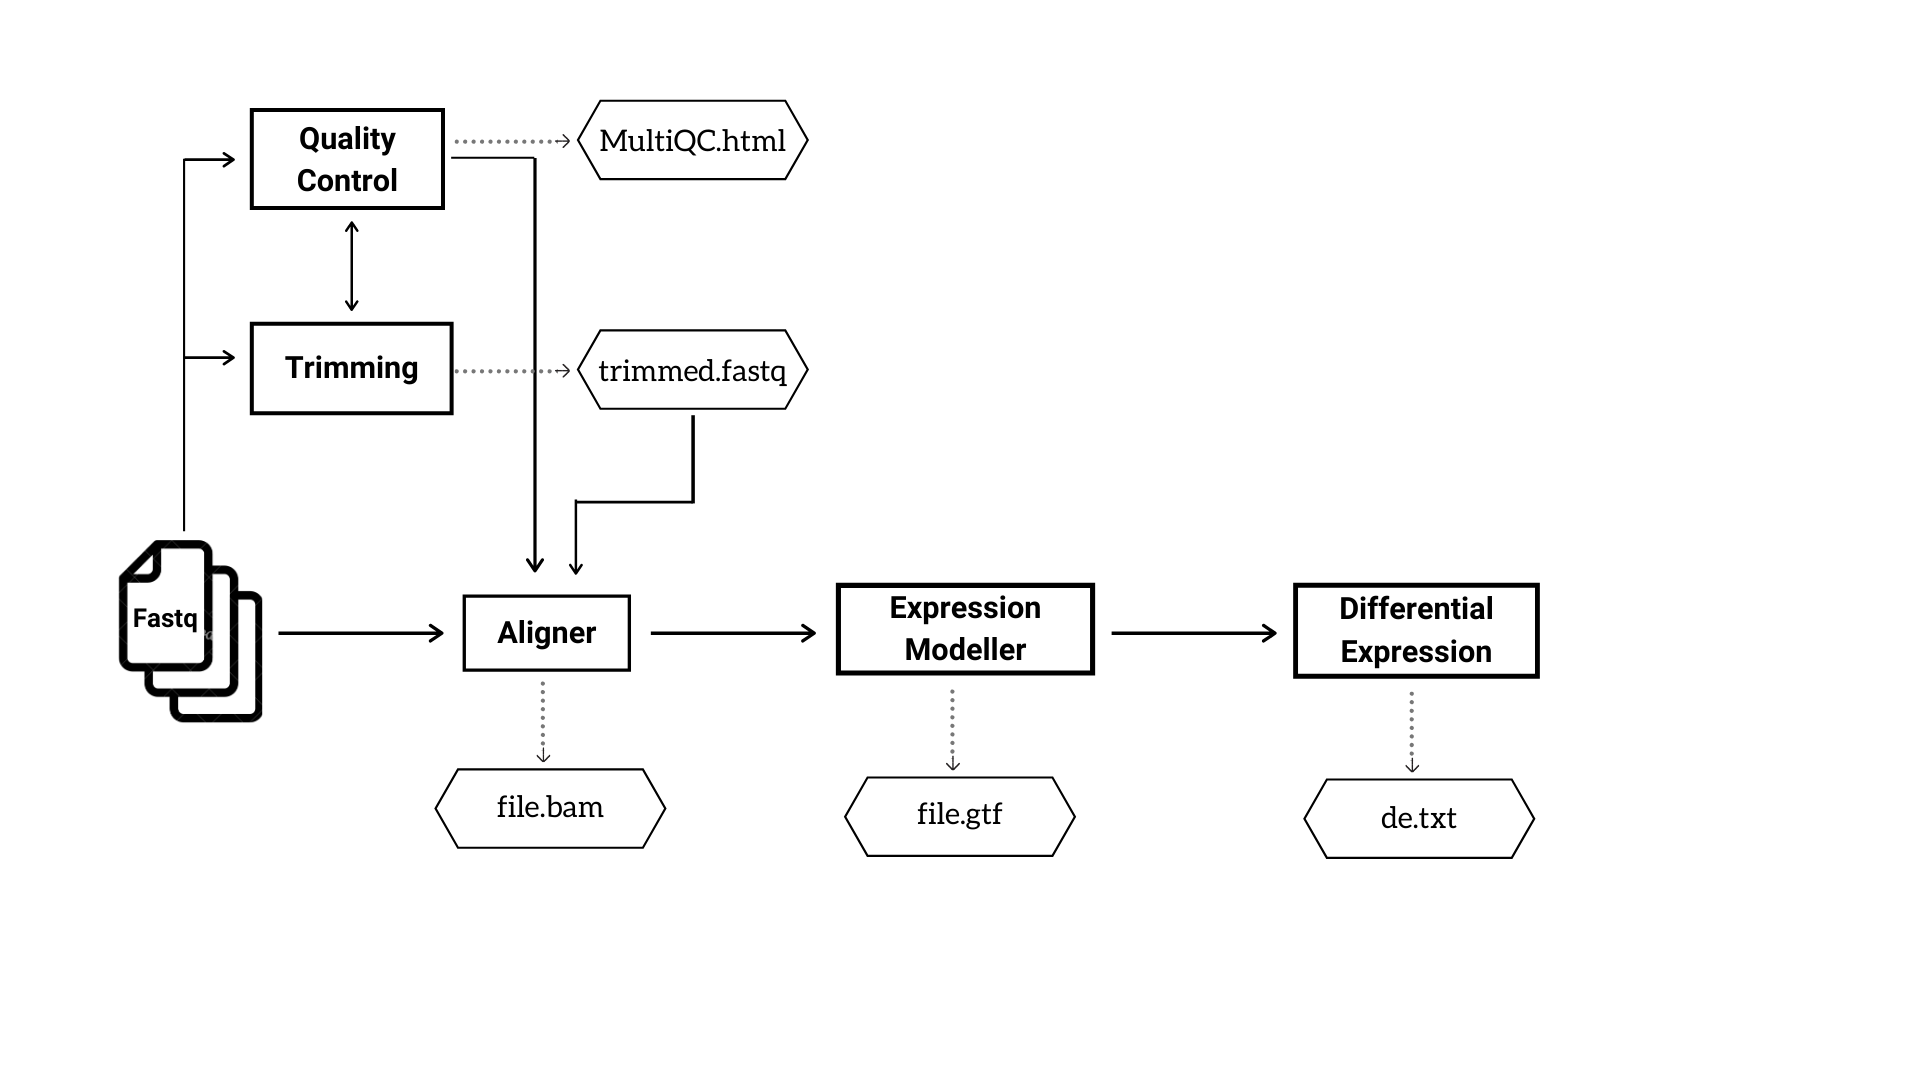 Figure 2: The analysis steps and major output files in RNA Seq pipeline.
Refer to the section 9 of Tutorials for the typical set of actions to run iCOMIC pipelines.
3.7. Output information
All outputs are stored in separate folders inside the main folder iCOMIC, for each pipeline along with log information.
DNA-Seq
DNA-Seq analysis generates five output folders as follows.
- MultiQC
Contains subfolders MultiQC, FastQC and Cutadapt. MultiQC contains consolidated html reports on the overall run statistics and a separate html file on merged FastQC reports of all the input samples. The folder FastQC contains quality reports of individual samples. It may also enclose FastQC report of trimmed reads if the user opts for trimming the input reads. The folder Cutadapt contains trimmed fastq files.
- Aligner
Contain bam outputs generated by the aligner.
- Variant Caller
This folder includes vcf files of identified variants.
- Annotator
Contains annotated vcf files.
- Index
This is an optional folder which contains the index files if the user chooses to generate index corresponding to the choice of aligner.
RNA-Seq
RNA-Seq analysis generates five output folders inside the main folder iCOMIC, as follows.
- MultiQC
Contains subfolders MultiQC, FastQC and Cutadapt. MultiQC contains consolidated html reports on the overall run statistics and a separate html file on merged FastQC reports of all the input samples. The folder FastQC contains quality reports of individual samples. It may also enclose FastQC report of trimmed reads if the user opts for trimming the input reads. The folder Cutadapt contains trimmed fastq files.
- Aligner
Contain bam outputs generated by the aligner.
- Expression Modeller
Contains count matrix representing the reads mapped to individual genes.
- Differential expression
Contain a text file with a consolidated list of differentially expressed genes.
- Index
This is an optional folder which contains the index files if the user chooses to generate index corresponding to the choice of aligner.
cTaG
cTaG (classify TSG and OG) is a tool used to identify tumour suppressor genes (TSGs) and oncogenes (OGs) using somatic mutation data.The cTaG model returns the list of all genes labelled as TSG or OG or unlabelled along with predictions made my each model and whether the gene is among top predictions.
NBDriver
NBDriver (NEIGHBORHOOD Driver) is a tool used to differentiate between driver and passenger mutations. It returns a list of all mutations labelled as Driver or Passenger.
4. Using iCOMIC for DNA-Seq or RNA-Seq analysis
4.1. Analysis steps DNA-Seq
DNA-Seq constitutes the Whole Genome/Exome Sequencing data analysis pipeline which permits the user to call variants from the input samples and annotate them. iCOMIC integrates a combination of 3 aligners, 4 variant callers and 2 annotators along with the tools for Quality control. The tool MultiQC is incorporated to render comprehensive analysis statistics.
Aligners:GEM-Mapper, BWA-MEM, Bowtie2Variant callers:GATK HC, samtools mpileup, freebayes, GATK Mutect2Annotators:Annovar, SnpEff
4.1.1. Input Requirements
The significant obligation is raw fastq files which can either be single-end or paired-end. Fastq read details can be specified in two different methods, either by uploading a folder containing the reads or using a tab-separated file describing the reads. If you choose the Upload from folder mode, the path to the folder containing the fastq files needs to be specified. Additionally, all the files in the folder need to be named in the format specified in the section Input file format.
Alternatively, if you decide to use the Upload from table mode, a tab-separated file consolidating particulars about the sample needs to be fed in. Refer to the Input file format section for formatting the table. An example tab separated file named units_sample.tsv is available at this link.
Furthermore, iCOMIC demands a path to the reference genome, a fasta file and gzipped vcf of the known variants corresponding to the reference genome.
Once all the fields are filled, you can proceed to the Quality Control tab using the next button.
4.1.2. Review of Input Samples
In the Quality Control widget, you can examine the quality of your samples for analysis by clicking on the Quality Control Results button. The tool MultiQC provides a consolidated report of Quality statistics generated by FastQC for all the samples. Additionally, iCOMIC permits you to trim the reads using Cutadapt if required. However one will be free to move ahead even without going through the Quality Check processes.
4.1.3. Setting up a pipeline
In the tool selection widget, you will be asked to choose your desired set of tools for analysis.
Aligner
You can choose a software for sequence alignment from the drop down menu. You will also need to input the genome index corresponding to the choice of aligner. No worries! iCOMIC allows you to generate the required index using the Generate index button. One will have the permission to change the values for the mandatory parameters displayed. Moreover, if you are an expert bioinformatician, iCOMIC allows you to play around with the advanced parameters. Clicking on the Advanced button would open a pop-up of all the parameters associated with a tool.
Variant Caller
This section permits you to choose a variant caller from the set of tools integrated. If the input sample is normal-tumor specific, then only those tools which call variants comparing the normal and tumor samples will be displayed. On the other hand, if you want to call variants corresponding to the reference genome, variant callers of that type would be displayed. iCOMIC allows you to set mandatory as well as advanced parameters for the selected tool.
Annotator
This section allows you to choose a tool for annotating your called variants and specify the parameters.
4.1.4. Initialization of the analysis
The Run tab displays an Unlock button and a Run button. Run is for initializing the analysis. When the analysis starts, if a warning icon pops up near the Unlock button, you need to click the Unlock button to unlock the working directory and then click Run to proceed with the analysis. Progress bar present in the tab allows you to examine the progress of analysis.
4.1.5. Results: A quick check
Once the analysis is completed, iCOMIC will automatically take you to the Results tab which displays three major results.
Analysis Statistics:Displays a MultiQC consolidated report of overall analysis statistics. This includes FastQC reports, Alignment statistics and variant statistics.Variants called:On clicking this button a pop up with thevcffile of variants called will be displayed.Annotated variants:Displays the annotatedvcffile.
4.2. Analysis steps RNA-Seq
RNA-Seq part allows you to identify the differentially expressed genes from RNA Sequencing data. iCOMIC integrates a combination of 2 aligners, 2 expression modellers and 2 differential expression tools along with the tools for Quality control. The tool MultiQC is incorporated to render comprehensive analysis statistics.
Aligners:STAR, HISAT2Expression modellers:StringTie, HTSeqDifferential expression:DESeq2, ballgown
Available pipelines:
- HISAT2-StringTie-ballgown
- STAR-StringTie-ballgown
- HISAT2-HTSeq-DESeq2
- STAR-HTSeq-DESeq2
4.2.1. Input Requirements
Similar to the DNA-Seq pipeline, the major requirement here is also raw fastq files, either single-end or paired-end. Fastq read details can be specified in two different methods, either by uploading a folder containing the reads or using a tab-separated file describing the reads. Refer to the Input file format section for preparing the input reads. Furthermore, the RNA-Seq part demands a path to the reference genome, a fasta file, annotated file in gtf format, and a transcript file.
Once all the fields are filled, you can proceed to the Quality Control tab using the next button.
4.2.2. Review of Input Samples
In the Quality Control widget, you can examine the quality of your samples for analysis by clicking on the Quality Control Results button. The tool MultiQC provides a consolidated report of Quality statistics generated by FastQC for all the samples. Additionally, iCOMIC permits you to trim the reads using Cutadapt if required. However one will be free to move ahead even without going through the Quality Check processes.
4.2.3. Setting up a pipeline
In the tool selection widget, you will be asked to choose your desired set of tools for analysis.
Aligner
You can choose a software for sequence alignment from the drop down menu. You will also need to input the genome index corresponding to the choice of aligner. No worries! iCOMIC allows you to generate the required index using the Generate index button. One will have the permission to change the values for the mandatory parameters displayed. Moreover, if you are an expert bioinformatician, iCOMIC allows you to play around with the advanced parameters. Clicking on the Advanced button would open a pop-up of all the parameters associated with a tool.
Expression Modeller
This section allows you to choose an expression modeller from the integrated list of tools for counting the reads with the help of annotation file. Users will also have the freedom to set parameters corresponding to the tool.
Differential Expression tool
Here you can choose a tool for quantifying differential expression and can also set parameters.
4.2.4. Initialization of the analysis
The Run tab displays an Unlock button and a Run button. Run is for initializing the analysis. When the analysis starts, if a
Select warning icon pops up near the unlock button, you need to click the unlock button to unlock the working directory and then click run to proceed with the analysis. Progress bar present in the tab allows you to examine the progress of analysis.
4.2.5. Results: A quick check
Once the analysis is completed, iCOMIC will automatically take you to the Results tab which displays three major results.
Analysis Statistics:Displays a MultiQC consolidated report of overall analysis statistics. This includes FastQC reports and Alignment statistics .Differentially Expressed Genes:On clicking this button a pop up with the list of differentially expressed genes will be displayed.Plots:Displays differentially expressed genes in R plots such as MA plot, Heatmap, PCA plot and box plot.
5. Using iCOMIC for cTaG and NBDriver tools
5.1. cTaG
cTaG (classify TSG and OG) is a tool used to identify tumour suppressor genes (TSGs) and oncogenes (OGs) using somatic mutation data. The cTaG model returns the list of all genes labelled as TSG or OG or unlabelled along with predictions made by each model and whether the gene is among the top predictions.
5.1.1. Input Requirements
A maf file is required to run the cTaG tool. A maf file can either be generated from the DNA-Seq output vcf file in the results tab or browsed locally. Apart from that, you can mention the parameters required to run the cTag in the parameters option provided.
5.1.2. Initialization of the analysis
You can click on the run button to initialize the analysis, once the necessary files have been uploaded.
5.1.3. Results
Once the analysis is completed, you can click on the Results button to view the results
5.2. NBDriver
NBDriver (NEIGHBORHOOD Driver) is a tool used to differentiate between driver and passenger mutations using features derived from the neighborhood sequences of somatic mutations. NBDriver returns a list of all mutations labelled as Driver or Passenger.
5.2.1. Input Requirements
In order to run NBDriver, the user needs to download the hg19 reference genome from this link and put it in the "/icomic/NBDriver_iCOMIC/" directory
A vcf file is required to run NBDriver. The vcf file can either be browsed from the DNA-Seq output directory or locally.
5.2.2. Initialization of the analysis
You can click on the run button to initialize the analysis, once the necessary files have been uploaded.
5.2.3. Results
Once the analysis is completed, you can click on the Results button to view the results
6. Walkthrough of pre-constructed pipeline
6.1. List of pipelines
- WGS data analysis Enables the user to identify variants from raw sequencing reads and functionally annotate them. Multiple tools are integrated in the WGS analysis pipeline.
- RNA-Seq data analysis RNA-Seq part enables quantification of gene expression. The pipeline provides a final output of a list of differentially expressed genes. (to be constructed as provided in the CANEapp manual)
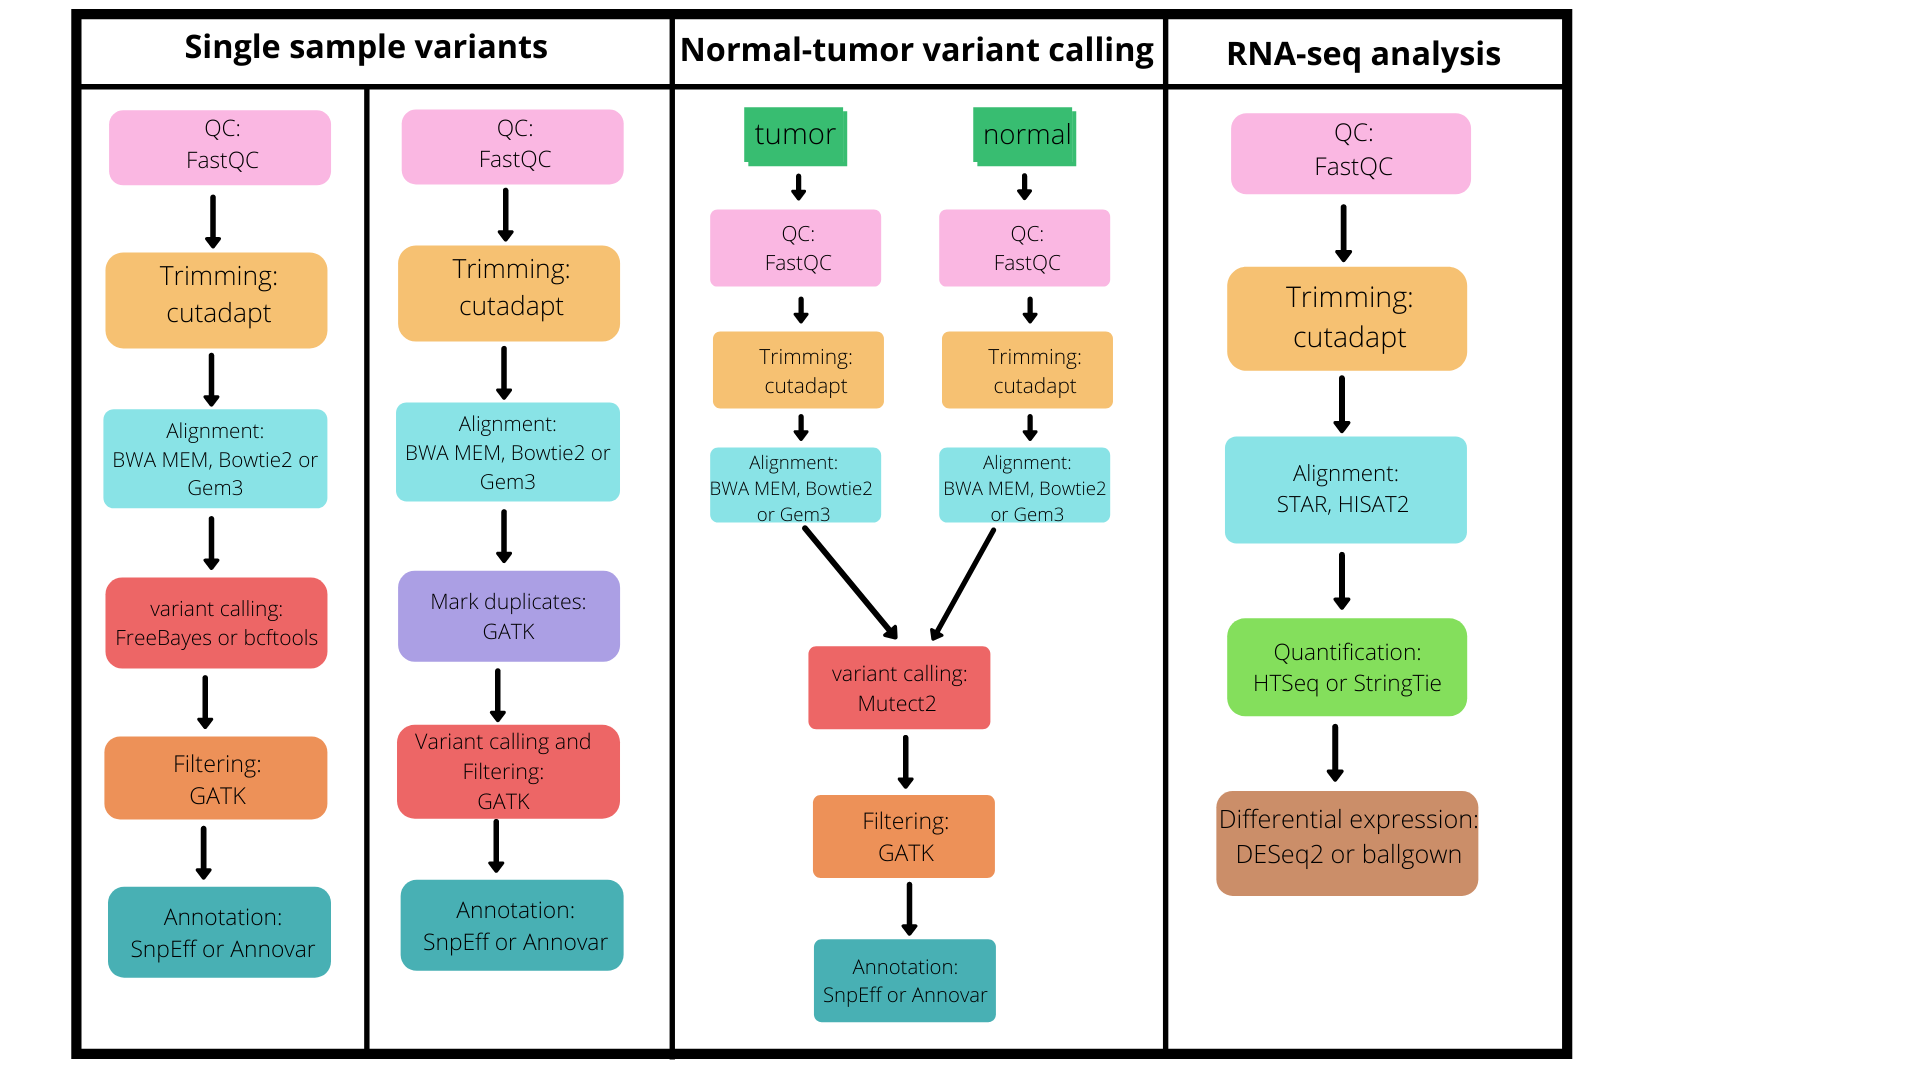 Figure 1: The figure below depicts the available pipelines supported by iCOMIC
6.2. Description of the tools used
Table shows the tools incorporated in iCOMIC
| Function | DNA-Seq Tools | RNA-Seq Tools |
|---|---|---|
| Quality Control | FastQC, MultiQC, Cutadapt | FastQC, MultiQC, Cutadapt |
| Alignment | GEM-Mapper, BWA-MEM, Bowtie2 | STAR, HISAT2 |
| Variant Calling | GATK HC, samtools mpileup, FreeBayes, GATK Mutect2 | - |
| Annotation | Annovar, SnpEff | - |
| Expression Modeller | - | StringTie, HTSeq |
| Differential Expression | - | DESeq2, ballgown |
6.3. Tools for Quality Control
FastQC
It is a popular tool that can be used to provide an overview of the basic quality control metrics for raw next generation sequencing data. There are a number different analyses (called modules) that may be performed on a sequence data set. It provides summary graphs enabling the user to decide on the directions for further analysis.
MultiQC
MultiQC is a modular tool to aggregate results from bioinformatics analyses across multiple samples into a single report. It collects numerical stats from different modules enabling the user to track the behavior of the data in an efficient manner.
Cutadapt
Cutadapt is a trimming tool that enables the user to remove adapter and primer sequences in an error-tolerant manner. It can also aid in demultiplexing, filtering and modification of single-end and paired-end reads. Essential parameters for the tool are listed below. The detailed list of parameters of the tool are available in Cutadapt documentation.
| Parameter | Description |
|---|---|
-a |
3’ Adapter sequence |
-g |
5’ adapter sequence |
-Z |
Compression level |
-u (n) |
Removes n reads unconditionally |
-q |
Quality cutoff |
Aligners
GEM-Mapper
It is a high-performance mapping tool that performs alignment of sequencing reads against large reference genomes. GEM Mapper has been identified as an efficient mapping tool by a benchmarking analysis performed along with this study. Listed below are some parameters of the tool GEM-Mapper. Other parameters can be found in GEM-Mapper github page
| Parameter | Description |
|---|---|
-t |
Threads |
-e |
--alignment-max-error |
--alignment-global-min-identity |
Minimum global-alignment identity required |
--alignment-global-min-score |
Minimum global-alignment score required |
BWA-MEM
One of the most commonly used aligners available. It is identified as a faster and accurate algorithm among the algorithms in BWA software package. It is known for aligning long sequence query reads to the reference genome and also performs chimeric alignment. The parameters for BWA-MEM include the following. The other parameters for the tool can be found in BWA manual page
| Parameter | Description |
|---|---|
-t |
Threads |
-k |
minSeedLength |
-w |
Band width |
-d |
Z-dropoff |
-r |
seedSplitRatio |
-A |
matchScore |
Bowtie2
Bowtie2 is a fast and efficient algorithm for aligning reads to a reference sequence. It comprises various modes wherein it supports local, paired-end and gapped alignment. The key parameters for Bowtie2 include the following. All parameters for Bowtie2 are listed in Bowtie2 manual.
| Parameter | Description |
|---|---|
--threads |
Threads |
--cutoff (n) |
Index only the first (n) bases of the reference sequences (cumulative across sequences) and ignore the rest. |
-seed |
The seed for pseudo-random number generator |
-N |
Sets the number of mismatches to allowed in a seed alignment during multiseed alignment |
dvc |
the period for the difference-cover sample |
STAR
STAR is a rapid RNA-Seq read aligner specializing in fusion read and splice junction detection. Important parameters for STAR is given below. The other parameters for the tool can be found in STAR manual page
| parameters | Description |
|---|---|
-- runThreadN |
NumberOfThreads |
--runMode |
genomeGenerate |
--genomeDir |
/path/to/genomeDir |
--genomeFastaFiles |
/path/to/genome/fasta1 /path/to/genome/fasta2 |
--sjdbGTFfile |
/path/to/annotations.gtf |
--sjdbOverhang |
ReadLength-1 |
HISAT2
It is a fast and sensitive alignment program applicable for both RNA-seq and Whole-Genome Sequencing data and is known for rapid and accurate alignment of sequence reads to a single reference genome. The key parameters for the tool are given below. The other parameters for the tool can be found in HISAT2 manual page
| parameters | Description |
|---|---|
- x (hisat-idx) |
The basename of the index for the reference genome |
-q |
Reads which are FASTQ files |
--n-ceil (func) |
Sets a function governing the maximum number of ambiguous characters (usually Ns and/or .s) allowed in a read as a function of read length |
--ma (int) |
Sets the match bonus |
--pen-cansplice (int) |
Sets the penalty for each pair of canonical splice sites (e.g. GT/AG) |
Variant Callers
GATK HC
Variant caller for single sample analysis
One of the extensively used variant callers. Calls variants from the aligned reds corresponding to the reference genome. Some of the parameters for GATK Haplotype caller are listed beow. The complete parameter list is available at GATK Haplotypecaller article page
| Parameters | Description |
|---|---|
-contamination |
Contamination fraction to filter |
-hets |
heterozygosity |
-mbq |
Min base quality score |
-minReadsPerAlignStart |
Min Reads Per Alignment Start |
Samtools mpileup
Variant caller for single sample analysis
Samtools mpileup together with BCFtools call identifies the variants. Some key parameters to look are listed below. Parameters in detail are found in Samtools-mpileup manual page
| Parameter | Description |
|---|---|
-d |
--max-depth |
-q |
Minimum mapping quality for an alignment to be used |
-Q |
Minimum base quality for a base to be considered |
freebayes
Variant caller for single sample analysis
FreeBayes is a variant detector developed to identify SNPs, Indels, MNPs and complex variants with respect to the reference genome. Key parameters for FreeBayes are listed below. Other parameters can be found in detain in FreeBayes parameter page
| Parameter | Description |
|---|---|
-4 |
Include duplicate-marked alignments in the analysis. |
-m |
minimum mapping quality |
-q |
minimum base quality |
-! |
minimum coverage |
-U |
read mismatch limit |
GATK Mutect2
Variant caller for normal-tumor sample analysis
This tool identifies somatic mutations such as indels and SNAs in a diseased sample compared to the provided normal sample, using the haplotype assembly strategy. Parameters specific to Mutect2 include the following. The complete parameter list is available at GATK Mutect2 manual page
| Parameter | Description |
|---|---|
--base-quality-score-threshold |
Base qualities below this threshold will be reduced to the minimum |
--callable-depth |
Minimum depth to be considered callable for Mutect stats. Does not affect genotyping. |
--max-reads-per-alignment-start |
Maximum number of reads to retain per alignment start position. |
-mbq |
Minimum base quality required to consider a base for calling |
Annotators
SnpEff
SnpEff tool performs genomic variant annotations and functional effect prediction. Key parameters for the tool SnpEff are listed below. Detailed list of parameters is given in SnpEff manual page
| Parameter | Description |
|---|---|
-t |
Use multiple threads |
-cancer |
perform 'cancer' comparisons (Somatic vs Germline) |
-q |
Quiet mode |
-v |
Verbose mode |
-csvStats |
Create CSV summary file instead of HTML |
Annovar
Annovar can be used to efficiently annotate functional variants such as SNVs and indels, detected from diverse genomes. The tool also provides the user with multiple annotation strategies namely Gene-based, region-based and filter-based. Key parameters for Annovar include the following. Details of the tool can be found in Annovar documentation page
| Parameter | Description |
|---|---|
--splicing_threshold |
distance between splicing variants and exon/intron boundary |
--maf_threshold |
filter 1000G variants with MAF above this threshold |
--maxgenethread |
max number of threads for gene-based annotation |
--batchsize |
batch size for processing variants per batch (default: 5m) |
Expression modellers
StringTie
StringTie is known for efficient and rapid assembly of RNA-Seq alignments into possible transcripts. It employs a novel network flow algorithm and an optional de novo assembly algorithm to assemble the alignments. The important parameters to look into are listed below. The other parameters for the tool can be found in StringTie Manual Page
| Parameters | Description |
|---|---|
--rf |
Assumes a stranded library fr-firststrand |
--fr |
Assumes a stranded library fr-secondstrand |
--ptf (f_tab) |
Loads a list of point-features from a text feature file (f_tab) to guide the transcriptome assembly |
-l (label) |
Sets (label) as the prefix for the name of the output transcripts |
-m (int) |
Sets the minimum length allowed for the predicted transcripts |
HTSeq
HTSeq facilitates in counting the number of mapped reads to each gene. It provides the user with multiple modes of usage and also allows the creation of custom scripts. Key parameters for the tool are given below. The other parameters for the tool can be found in HTSeq Manual Page
| Parameters | Description |
|---|---|
-f |
Format of the input data |
-r |
For paired-end data, the alignment have to be sorted either by read name or by alignment position |
-s |
whether the data is from a strand-specific assay |
-a |
skip all reads with alignment quality lower than the given minimum value |
-m |
Mode to handle reads overlapping more than one feature |
Differential Expression tools
ballgown
ballgown is an R language based tool that enables the statistical analysis of assembled transcripts and differential expression analysis along with its visualization. Key arguments for the tool are given below. The other arguments for the tool can be found in ballgown Manual page
| Arguments | Description |
|---|---|
samples |
vector of file paths to folders containing sample-specific ballgown data |
dataDir |
file path to top-level directory containing sample-specific folders with ballgown data in them |
samplePattern |
regular expression identifying the subdirectories of\ dataDir containing data to be loaded into the ballgown object |
bamfiles |
optional vector of file paths to read alignment files for each sample |
pData |
optional data.frame with rows corresponding to samples and columns corresponding to phenotypic variables |
meas |
character vector containing either "all" or one or more of: "rcount", "ucount", "mrcount", "cov", "cov_sd", "mcov", "mcov_sd", or "FPKM" |
DESeq2
It Uses negative binomial distribution for testing differential expression using R language. Some of the arguments to look into are given below. The other arguments for the tool can be found in DESeq2 Manual Page
| Arguments | Description |
|---|---|
object |
A Ranged Summarized Experiment or DESeqDataSet |
groupby |
a grouping factor, as long as the columns of object |
run |
optional, the names of each unique column in object |
renameCols |
whether to rename the columns of the returned object using the levels of the grouping factor |
value |
an integer matrix |
7. Creating a custom pipeline
7.1. Shell scripts to be written by the user
iCOMIC integrates most of the best practise tools for Whole Genome sequencing and RNA-seq data analysis. The toolkit provides the user the complete freedom to choose any compatible combination of tools for analysis. iCOMIC permits a user to add a new tool as well. If you are a developer, adding a new tool is easy as iCOMIC relies on Snakemake where the codes are very readable. The primary thing to be done for integrating an additional tool is to create a rule file inside the directory iCOMIC/rules. Name the file as [TOOL_NAME].smk. The major thing to be taken care of is the name of input and output files. It should match the other tools of the corresponding analysis step.
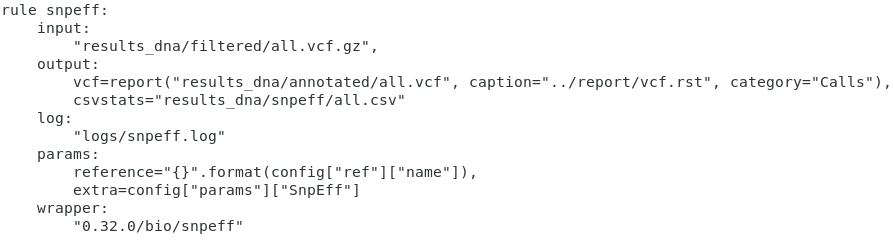
Parameters can be specified in the rule itself in the section params. If a snakemake wrapper is available for your choice of tool, that can be used, otherwise you need to write a shell command. List of snakemake wrappers are available in Snakemake wrapper repository.
7.2. How to run a custom pipeline
The user should create the rule for the new pipeline as mentioned in Section 7.1 . The user can either run the pipeline without GUI or with GUI. To run without GUI the user should save the created rule as snakefile and can simply type the following command in the terminal.
$ snakemake --use-conda -S snakefile_name
For running with iCOMIC, the user should edit icomic_v0.py file. The user should first choose the pipeline and edit accordingly.
8. Viewing and analyzing results
8.1. MultiQC reports
The tool multiQC compiles the analysis statistics for different tools and provides a consolidated report. The tool is used to visualize the analysis results at multiple stages in iCOMIC. The Quality Control part in iCOMIC analyses the quality of all input reads using FastQC. MultiQC compiles the FastQC reports for each sample and provides a consolidated comprehensive report. MultiQC is used again to summarise the entire analysis statistics. In the case of Whole genome sequencing, the MultiQC report includes a compiled FastQC report, alignment statistics and statistics of the variants identified. On the other hand, the MultiQC report in the RNA-Seq analysis part includes results from tools such as FastQC, Cutadapt, and STAR.
8.2. Plots generated in RNA-Seq
Differential Expression tools generate R plots such as MA plot, Heatmap, PCA plot and box plot displays the predicted differentially expressed genes. MA plot helps to find log2 fold changes,Heatmap helps in exploring the count matrix, PCA Plot visualizes the overall effect of experimental covariates and batch effects and box plots used to find count outliers.
8.3. List of differentially expressed genes in RNA-Seq
A text file with a list of all differentially expressed genes is displayed. The text file contains columns representing Gene Id’s, fc, pval, qval and logfc etc.
8.4. Variants Called in DNA-Seq
iCOMIC displays the variants identified in vcf format. In the results tab, the user can click on the click button and a pop-up with the vcf file will be displayed.
8.5. Annotated variants in DNA-Seq
Here the vcf file of annotated variants are displayed.
9. Tutorials
9.1. What is it?
iCOMIC (Integrating Context Of Mutation In Cancer) is an open-source, standalone tool for genomic data analysis characterized by a Python-based Graphical User Interface, automated bioinformatics pipelines for analyzing Whole genome/exome and transcriptomic data along with Machine Learning tools, cTaG and NBDriver for cancer related data analysis. It serves as a point and click application facilitating genomic data analysis accessible to researchers with minimal programming expertise. iCOMIC takes in raw sequencing data in FASTQ format as an input, and outputs insightful statistics on the nature of the data. iCOMIC toolkit is embedded in Snakemake, a workflow management system and is characterized by a user-friendly GUI built using PyQt5 which improves its ease of access. The toolkit features many independent core workflows in both whole genomic and transcriptomic data analysis pipelines.
9.2. Prerequisites:
- Linux/Windows/Mac (MacOS v10.15.5 or above) platform
- Python 3.6 and above
- Miniconda
- iCOMIC package downloaded from GitHub
9.3. Conda Installation
The entire source code for the tool is available at this link
Create an environment and install the dependencies associated with iCOMIC by using the following command:
$ cd iCOMIC-main
$ conda env create -f icomic_env.yml #for Linux users
$ conda env create -f icomic_env_mac.yml #for MacOS users
$ conda activate icomic_env
$ pip install -e icomic #for the first time only
$ cd icomic #path/to/icomic directory
$ icomic
$ conda deactivate #after completing the analysis
9.4. Testing
The user can test the iCOMIC pipeline using the demo data, reference genome, known variants file, annotation file to run DNA-Seq, RNA-Seq, cTaG and NBDriver provided in this link.
The path to the respective samples are:
- DNA samples - dna_germline_samples or dna_somatic_samples
- RNA samples - rna_samples
- cTaG - variants.maf
- NBDriver - NBDriver_vcf.vcf
After downloading and creating the environment to run iCOMIC, open iCOMIC GUI by simply typing ‘icomic’ in the terminal and then follow the steps provided below:
DNA-Seq
Germline variant calling
- Click upload from Table
- Sample table path - dna_germline_samples/unit_samples.tsv
NOTE:Edit the paths inside the tsv file before uploading.
- Reference Genome path - genome.chr21.fa
- Reference Known Variant path - dbsnp.vcf.gz
- Enter Threads and proceed with the steps given in the section 9.5
Somatic variant calling
- Click upload from Folder
- Sample Folder path - dna_somatic_samples
- Reference Genome path - hg38.fa
- Reference Known Variant path - clinvar_20191231.vcf.gz
- Enter Threads and proceed with the steps given in the section 9.5
RNA-Seq
- click upload from Folder
- Sample Folder path - rna_samples
- Fasta File path - hg38.chr22.fa
- Annotated File path - chr22_refGene.gtf
- Enter Threads and proceed with the steps given in the section 9.5
cTaG
- Path to MAF file - variants.maf
- Enter Parameters and click Run
Refer section 9.5 for more details
NBDriver
In order to run NBDriver, the user needs to download the hg19 reference genome from this link and put it in the "/iCOMIC/NBDriver_iCOMIC/" directory
- Path to VCF file - NBDriver_vcf.vcf
- Click Run
Refer section 9.5 for more details
9.5. Analysis quick guide
9.5.1 Launching the wrapper
iCOMIC can be launched using a simple command in the terminal.
$ icomic
9.5.2 Running iCOMIC: A quick walkthrough
Here is a typical set of actions to run iCOMIC pipelines:
- Select a pipeline
- Choose the mode of input
- Input the required data fields
- Proceed to the next tab if you want to skip Quality Check
- Or click on the
Quality Control Resultsbutton to view a consolidated MultiQC report of Quality statistics - Check
yesif you want to do trimming and also mention the additional parameters as per requirement - Tool for Quality Control: FastQC
- Tool for trimming the reads: Cutadapt
- Choose the tools of interest from
Tool selectiontab and set the parameters as required - For the choice of aligner, the corresponding genome index file needs to be uploaded if available, or the user can generate the index file using the Generate Index button
- Click
Runon the next tab to run the analysis - Once the analysis is completed, the
Resultstab will be opened - DNA-Seq results include a MultiQC report comprising the statistics of the entire analysis, a file consisting of the variants called and the corresponding annotated variant file
- Results for RNA-Seq analysis include multiQC analysis statistics, R plots such as MA plot, Heatmap, PCA plot and box plot and list of differentially expressed genes
- Proceed to cTaG/NBDriver tab for further analysis if needed
9.5.3 Adding samples: Method one
iCOMIC accepts input information in two different modes. In the first method, the user can feed the path to a folder containing raw fastq files. For the direct upload of a sample folder, the folder should contain only the samples and the sample file names should be in a specific format:
{sample_name}_{condition}_Rep{replicate_number}_R{1 / 2}.fastq
{sample_name}should be replaced with the sample name{condition}should be replaced with the nature of the sample, normal or tumor. If you are using a germline variant calling pipeline, the condition should be normal for all the samples{replicate_number}should be replaced by the number of replicate- If the sample is paired end,
{1 / 2}should be replaced by 1 or 2 accordingly for forward and reverse sequences. If the sample is single end, {1 / 2} can be replaced by 1
9.5.4 Adding samples: Method two
The user can provide a table consolidating particulars of raw data. The sample information should be given in a tab delimited file with a header row. The Column names should be:
- Sample : The Sample name
- Unit : The number of replicates
- Condition : Nature of the sample, normal or tumor
- fq1 : The path of Read 1
- fq2 : Path of Read 2, if you are working with single-end reads only, the ‘fq2’ column can be left blank
9.5.5 Adding samples: specifying DNA-seq workflow
The significant obligation is raw fastq files which can either be single-end or paired-end. Fastq read details can be specified in two different methods, either by uploading a folder containing the reads or using a tab-separated file describing the reads as specified in the previous sections. Other input requirements and the file specifications are as mentioned:
- Samples Folder : Path to the folder containing samples satisfying the conditions mentioned in section 3
- Samples Table : Path to the tsv file generated according to instructions in section 4 as an alternative to Samples folder
- Reference Genome : Path to the reference genome. The file should have an extension .fa
- Reference Known Variant : Path to the reference known variants file. The file should be a bgzipped vcf
- Maximum threads : The maximum number of threads that can be used for running each tool. Once all the fields are filled, you can proceed to the Quality Control tab using the next button.
 Figure 1: Input tab of DNA Seq pipeline
9.5.6 Adding samples: specifying RNA-seq workflow
Similar to the DNA-Seq pipeline, the major requirement here is also raw fastq files, either single-end or paired-end. Fastq read details can be specified in two different methods, either by uploading a folder containing the reads or using a tab-separated file describing the reads, as specified in the previous sections. Other input requirements and file specifications for RNA-seq workflow are mentioned below.
- Samples Folder : Path to the folder containing samples satisfying the conditions mentioned in section 3
- Samples Table : Path to the tsv file generated according to instructions in section 4 as an alternative to Samples folder
- Fasta file : Path to the reference genome. The file should have an extension .fa
- Annotated file : Path to the gtf annotation file
- Maximum threads : The maximum number of threads that can be used for running each tool. Once all the fields are filled, users can proceed to the Quality Control tab using the next button.
 Figure 2: Input tab of RNA Seq pipeline
9.5.7 Review of Sample quality
In the Quality Control widget, you can examine the quality of your samples for analysis by clicking on the Quality Control Results button. The tool MultiQC provides a consolidated report of Quality statistics generated by FastQC for all the samples. Additionally, iCOMIC permits you to trim the reads using Cutadapt if required.
However, it is also possible to move ahead without going through the Quality Check process. The Quality Control widget is more or less identical for DNA and RNA seq workflows.
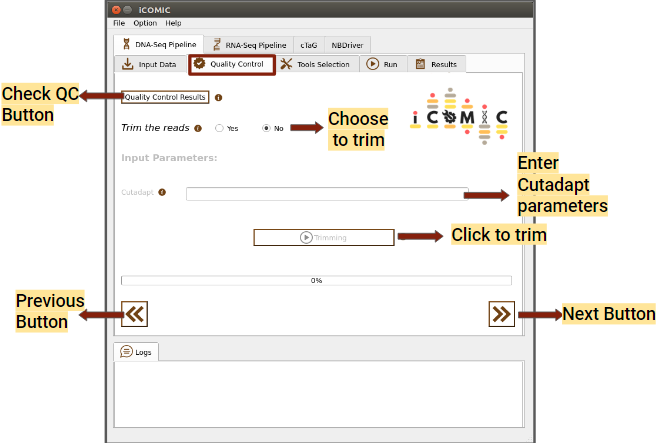 Figure 3: Quality Control tab of DNA Seq pipeline
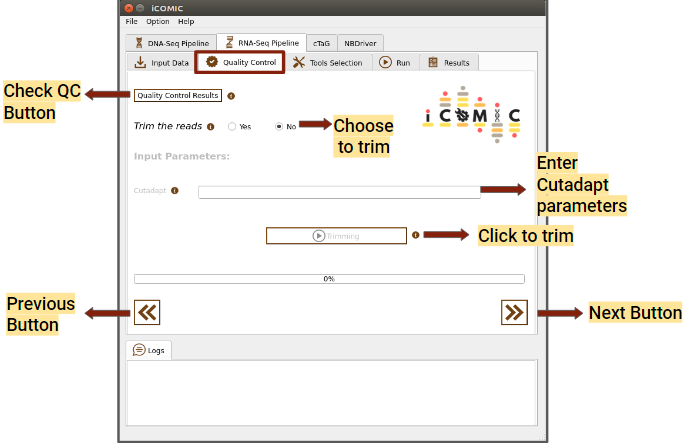 Figure 4: Quality Control tab of RNA Seq pipeline
9.5.8 Specifying analysis settings DNA seq
DNA-Seq constitutes the Whole Genome/Exome Sequencing data analysis pipeline which permits the user to call variants from the input samples and annotate them. iCOMIC integrates a combination of 3 aligners, 5 variant callers and 2 annotators along with the tools for Quality control. The tool MultiQC is incorporated to render comprehensive analysis statistics.
In the tool selection widget, you will be asked to choose your desired set of tools for analysis.
- Aligner
You can choose a software for sequence alignment from the drop down menu. You will also need to input the genome index corresponding to the choice of aligner. iCOMIC allows you to generate the required index using the Generate index button. One will have the permission to change the values for the mandatory parameters displayed. Moreover, if you are an expert bioinformatician, iCOMIC allows you to play around with the advanced parameters. Clicking on the Advanced button would open a pop-up of all the parameters associated with a tool.
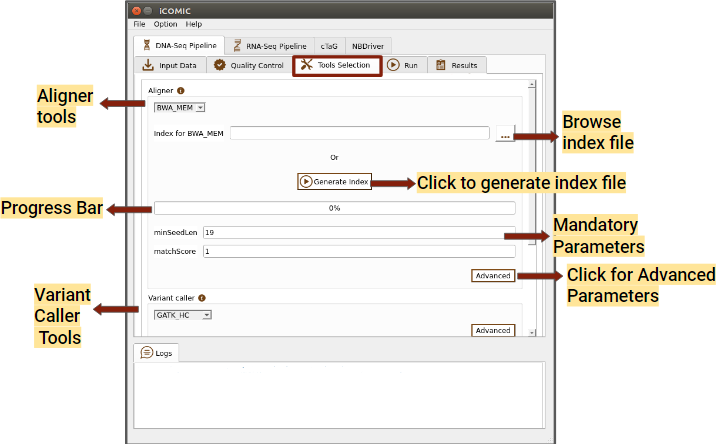 Figure 5: Tools tab of DNA Seq pipeline
- Variant Caller
This section permits you to choose a variant caller from the set of tools integrated. If the input sample is normal-tumor specific, then only those tools which call variants comparing the normal and tumor samples will be displayed. On the other hand, if you want to call variants corresponding to the reference genome, variant callers of that type would be displayed. iCOMIC allows you to set mandatory as well as advanced parameters for the selected tool.
- Annotator
This section allows you to choose a tool for annotating your called variants and specify the parameters.
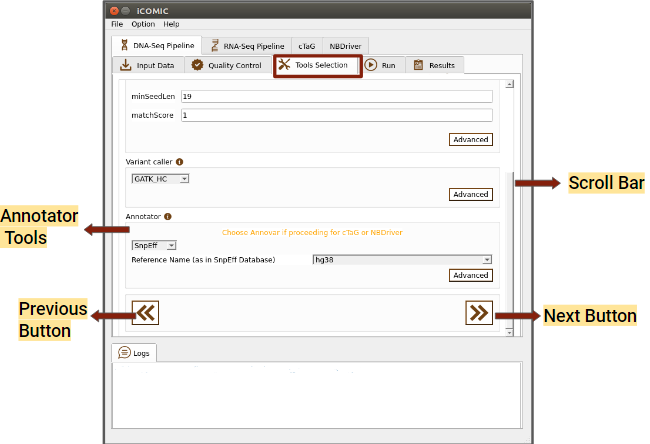 Figure 6: Tools tab of DNA Seq pipeline
9.5.9 Setting up differential gene expression analysis
RNA-Seq part allows you to identify the differentially expressed genes from RNA Sequencing data. iCOMIC integrates a combination of 2 aligners, 2 expression modellers and 2 differential expression tools along with the tools for Quality control. The tool MultiQC is incorporated to render comprehensive analysis statistics.
Available pipelines:
- HISAT2-StringTie-ballgown
- STAR-StringTie-ballgown
- HISAT2-HTSeq-DESeq2
- STAR-HTSeq-DESeq2
- Aligner
You can choose a software for sequence alignment from the drop down menu. You will also need to input the genome index corresponding to the choice of aligner. No worries! iCOMIC allows you to generate the required index using the Generate index button. One will have the permission to change the values for the mandatory parameters displayed. Moreover, if you are an expert bioinformatician, iCOMIC allows you to play around with the advanced parameters. Clicking on the Advanced button would open a pop-up of all the parameters associated with a tool.
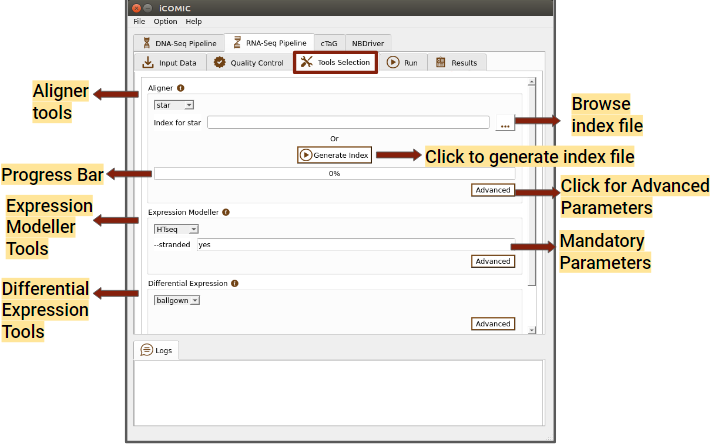 Figure 7: Tools tab of RNA Seq pipeline
- Expression Modeller
This section allows you to choose an expression modeller from the integrated list of tools for counting the reads with the help of annotation file. Users will also have the freedom to set parameters corresponding to the tool.
- Differential Expression tool
Here you can choose a tool for quantifying differential expression and can also set parameters.
 Figure 8: Tools tab of RNA Seq pipeline
9.5.10 Submitting the analysis
The Run tab consists of a Run button to initialize and proceed with the analysis. Progress bar present in the tab allows you to examine the extent to which the process has been completed.
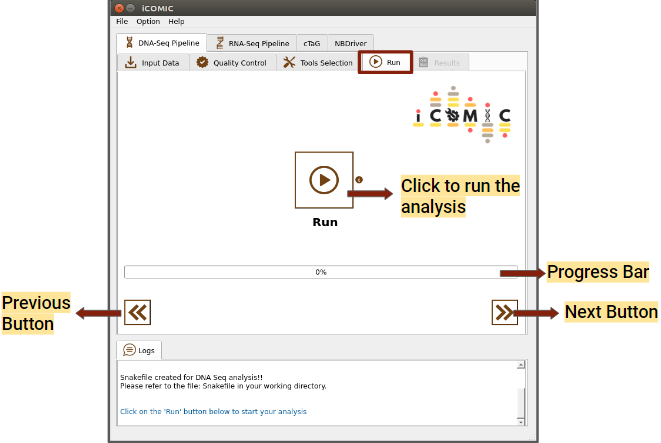 Figure 9: Run tab of DNA Seq pipeline
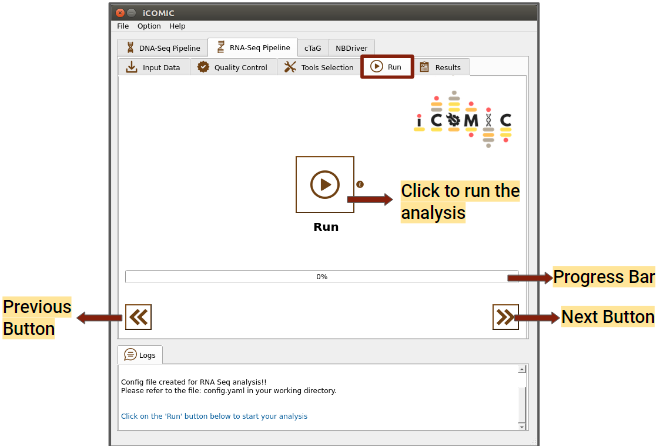 Figure 10: Run tab of RNA Seq pipeline
9.5.11 Retrieving the data
Once the analysis is completed, iCOMIC will automatically move on to the Results tab which displays three major results.
- DNA-Seq
The results displayed for DNA seq workflow are listed below.
- Analysis Statistics
Displays a MultiQC consolidated report of overall analysis statistics. This includes FastQC reports, Alignment statistics and variant statistics.
- Variants called
On clicking this button a pop up with the vcf file of variants called will be displayed.
- Annotated variants
Displays the annotated vcf file
 Figure 11: Results tab of DNA Seq pipeline
- RNA-seq
The results displayed for DNA seq workflow are listed below.
- Analysis Statistics
Displays a MultiQC consolidated report of overall analysis statistics. This includes FastQC reports and Alignment statistics
- Differentially Expressed Genes
On clicking this button a pop up with the list of differentially expressed genes will be displayed.
- Plots
Displays differentially expressed genes in R plots such as MA plot, Heatmap, PCA plot and box plot.
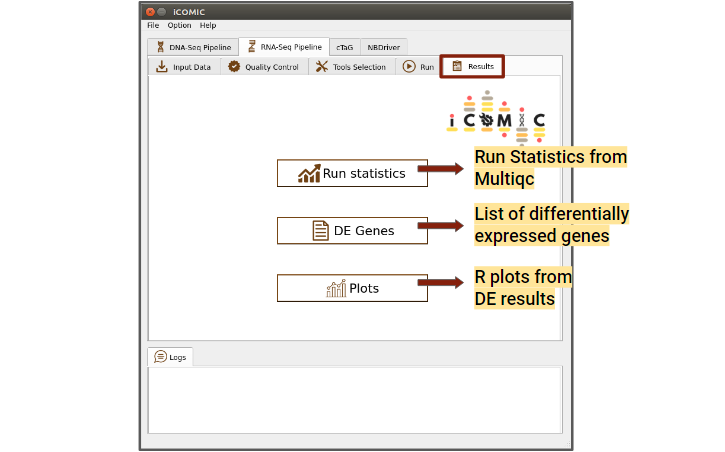 Figure 12: Results tab of RNA Seq pipeline
9.5.12 Analysis with BAM input
iCOMIC allows the user to start the analysis with aligned BAM files. For running iCOMIC with BAM files as input, the files should be sorted and stored in a folder named ‘results_dna/mapped’ or ‘results/mapped’ in the case DNA seq and RNA seq workflows respectively. The BAM files should be named in the format {sample}-{unit}-{condition}.sorted.bam. It is advised that while choosing this approach, the input is provided as a table. The sample information should be specified as mentioned in section 3 with fq1 and fq2 columns empty.
9.5.13 Running cTaG
cTaG (classify TSG and OG) is a tool used to identify tumour suppressor genes (TSGs) and oncogenes (OGs) using somatic mutation data. A maf file is required to run the cTaG tool, it can either be generated from the DNA-Seq output vcf file in the results tab or browsed locally. Added to that, you can mention the parameters required to run the cTag in the parameters option provided.You can click on the run button to initialize the analysis, once the necessary files have been uploaded. Once the analysis is completed, you can click on the Results button to view the results.
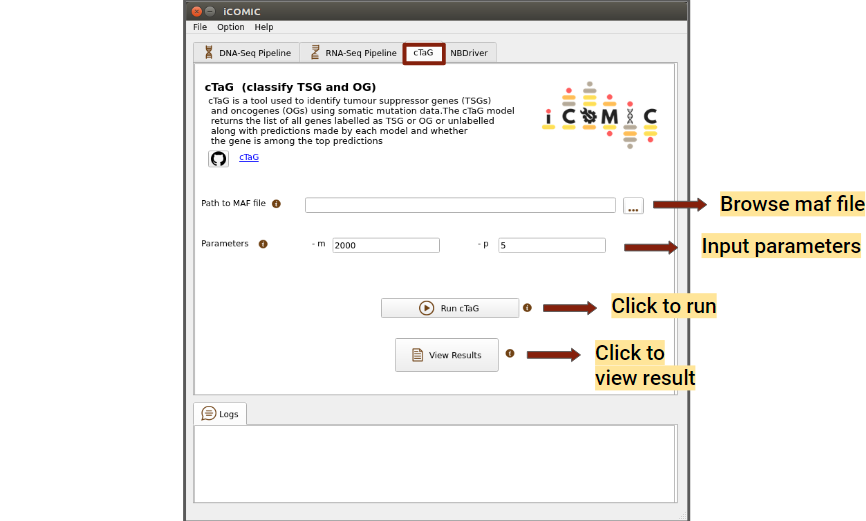 Figure 13: cTaG tab
9.5.14 Running NBDriver
NBDriver (NEIGHBORHOOD Driver) is a tool used to differentiate between driver and passenger mutations. A vcf file is required to run NBDriver, it can either be browsed from the DNA-Seq output directory or locally. In order to run NBDriver, the user needs to download the hg19 reference genome from this link and put it in the "/icomic/NBDriver_iCOMIC/" directory. You can click on the run button to initialize the analysis, once the necessary files have been uploaded. Once the analysis is completed, you can click on the Results button to view the results.
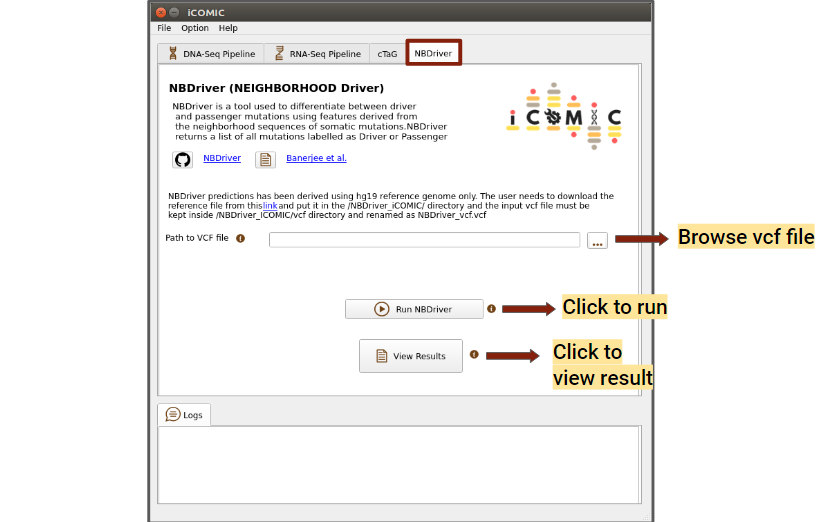 Figure 14: NBDriver tab
9.6 Retrieving logs
The Logs tab at the bottom of each section in the GUI displays the commands executed by the user. Seperate log for each tools are available inside logs folder created during the analysis. The user can check the log files at any time.
10. Troubleshooting runtime issues
10.1. FAQs
- General
How do I cite iCOMIC?
Sithara, Anjana Anilkumar, Devi Priyanka Maripuri, Keerthika Moorthy, Sai Sruthi Amirtha Ganesh, Philge Philip, Shayantan Banerjee, Malvika Sudhakar, and Karthik Raman. “ICOMIC: A Graphical Interface-Driven Bioinformatics Pipeline for Analyzing Cancer Omics Data,” September 20, 2021. https://doi.org/10.1101/2021.09.18.460896
Where can I access the latest iCOMIC source code?
As a Windows user, how do I set up iCOMIC?
Same as other operating systems.
How to solve ‘docker: Got permission denied while trying to connect to the Docker daemon socket at unix’ error while installing iCOMIC with Docker?
Please change the permission of socket file by running the command
$ sudo chmod 666 /var/run/docker.sock
It should solve the issue.
How to solve ‘xhost: unable to open display “:0”’ while Docker installation of iCOMIC?
$ xhost local:docker
or
$ xhost local:root
Running either one of these commands should solve the issue
- New Users
How do I report bugs and suggest improvements for iCOMIC?
You can post the issues in this link.
11. Changelog
12. Glossary
- GTF- Gene Transfer Format
- NGS - Next Generation Sequencing
- GUI - Graphical User Interface
- DNA-Seq - DNA Sequencing (Whole Genome/exome Sequencing)
- RNA-Seq - RNA Sequencing
- iCOMIC - Integrating the Context Of Mutations In Cancer